In a nutshell, surprisingly well. This article looks at (a) geographic areas that have been performing better
; (b) sectors that have been performing better; and (c) general trends in valuation.
(a) M&A Performance by Geographic Area
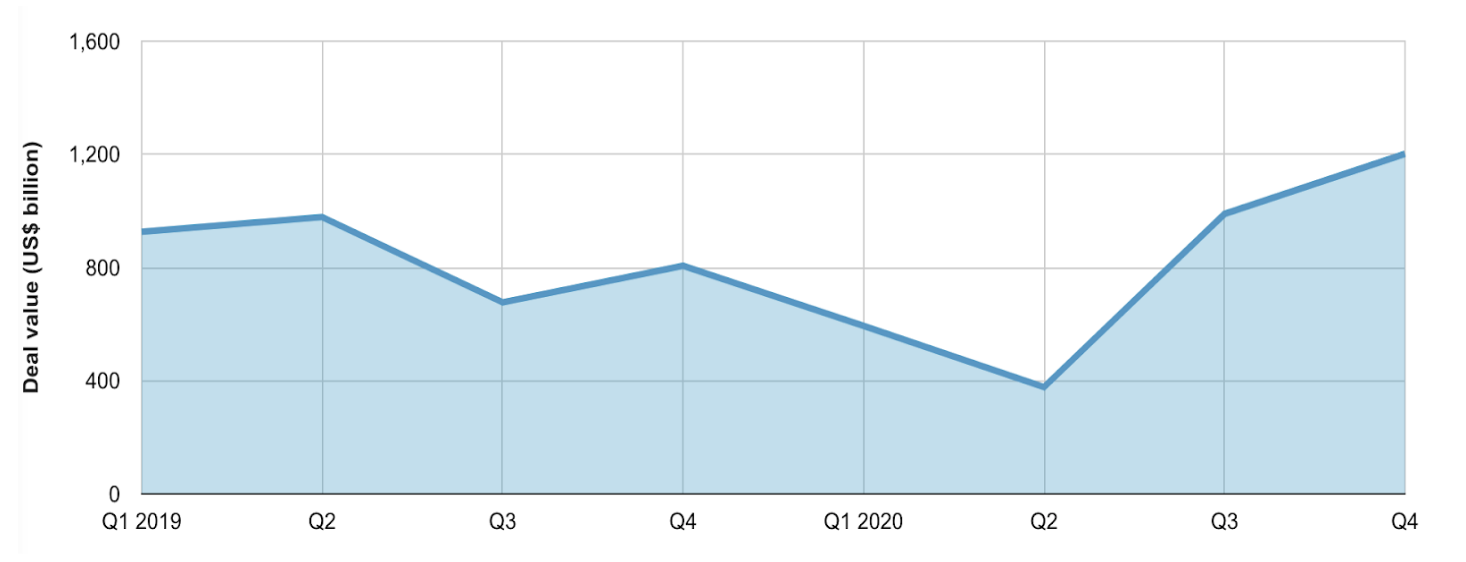
While M&A experienced a “near death” experience worldwide in Q2 2020, by Q4, M&A activity even exceeded pre-pandemic levels:
Exhibit 1: M&A activity by value from Q1 2019 to Q4 2020 worldwide1
 The value of M&A transactions in Central Europe (excluding Russia) increased by 28% in 2020 over 2019. As the Exhibit below demonstrates, Central Europe was the only geographic area in the world where an increase in value of transactions was observable:
Exhibit 2: Percent Rise/Fall in value of deals involving targets in region (H1 2019 vs H1 2020)2
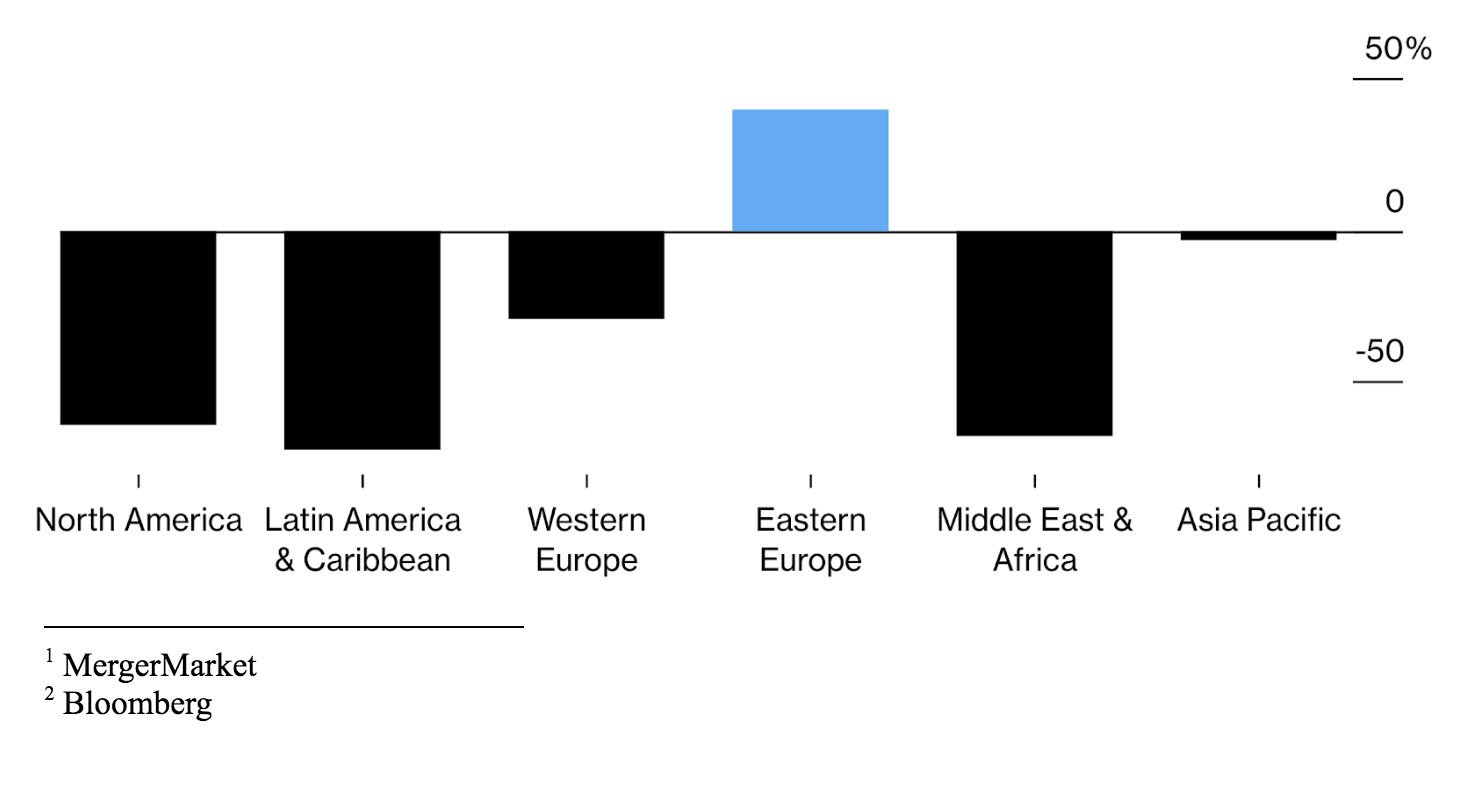 It should be noted that during this time frame, global volume of transactions decreased by 7% and the number of transactions in Central Europe decreased 28%3.
As the graph below demonstrates, even on a population-adjusted basis, Poland and Czech Republic by far outperformed Hungary and Slovakia.
Exhibit 3: M&A activity in volume and in value for the V44 Countries in 20205
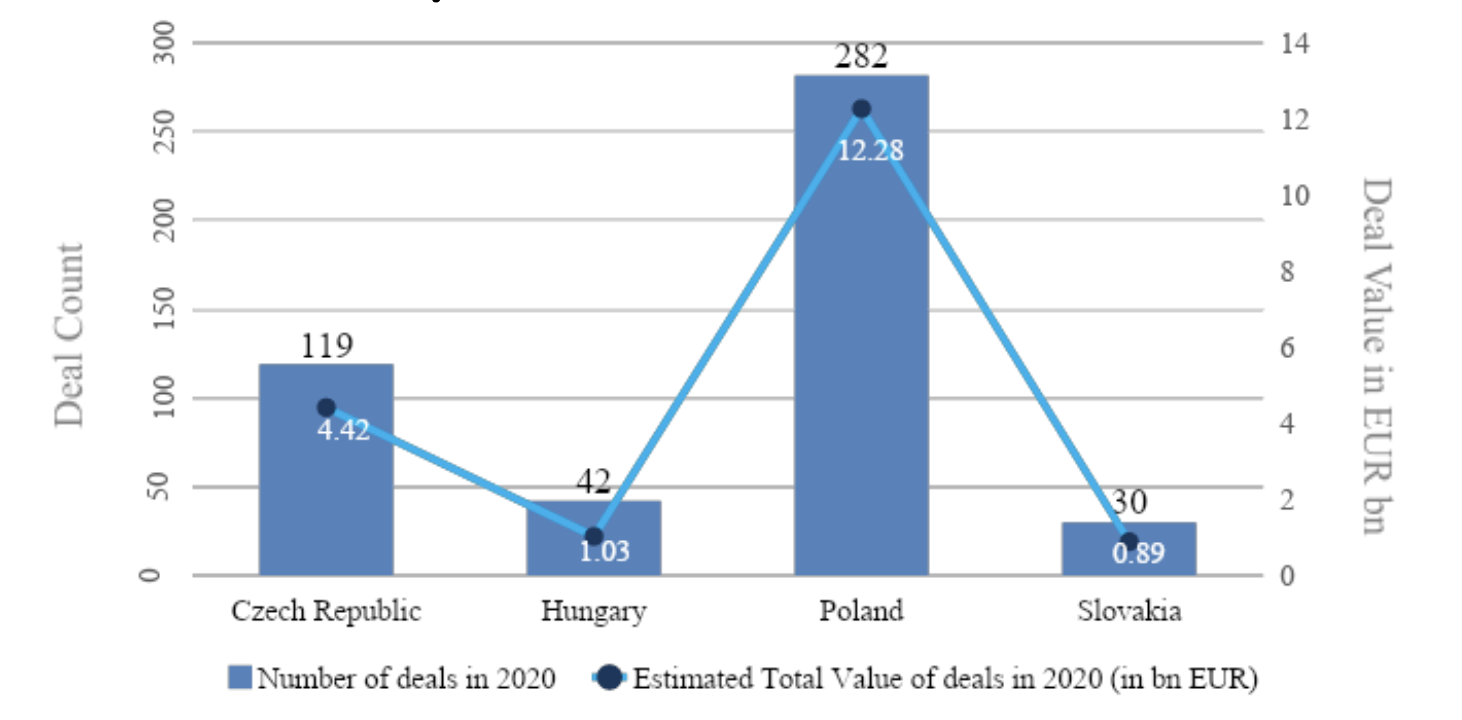 In Poland, value of transactions rose 41% to €11.2bn from 2019 to 2020, despite Covid, though the number of transactions fell from 154 to 124 during the same period.
For the other three Visegrád countries there was a sharp decline in both volume and number of transactions.
Exhibit 4: Degree to which foreign investment was responsible for inbound M&A activity in Central Europe6
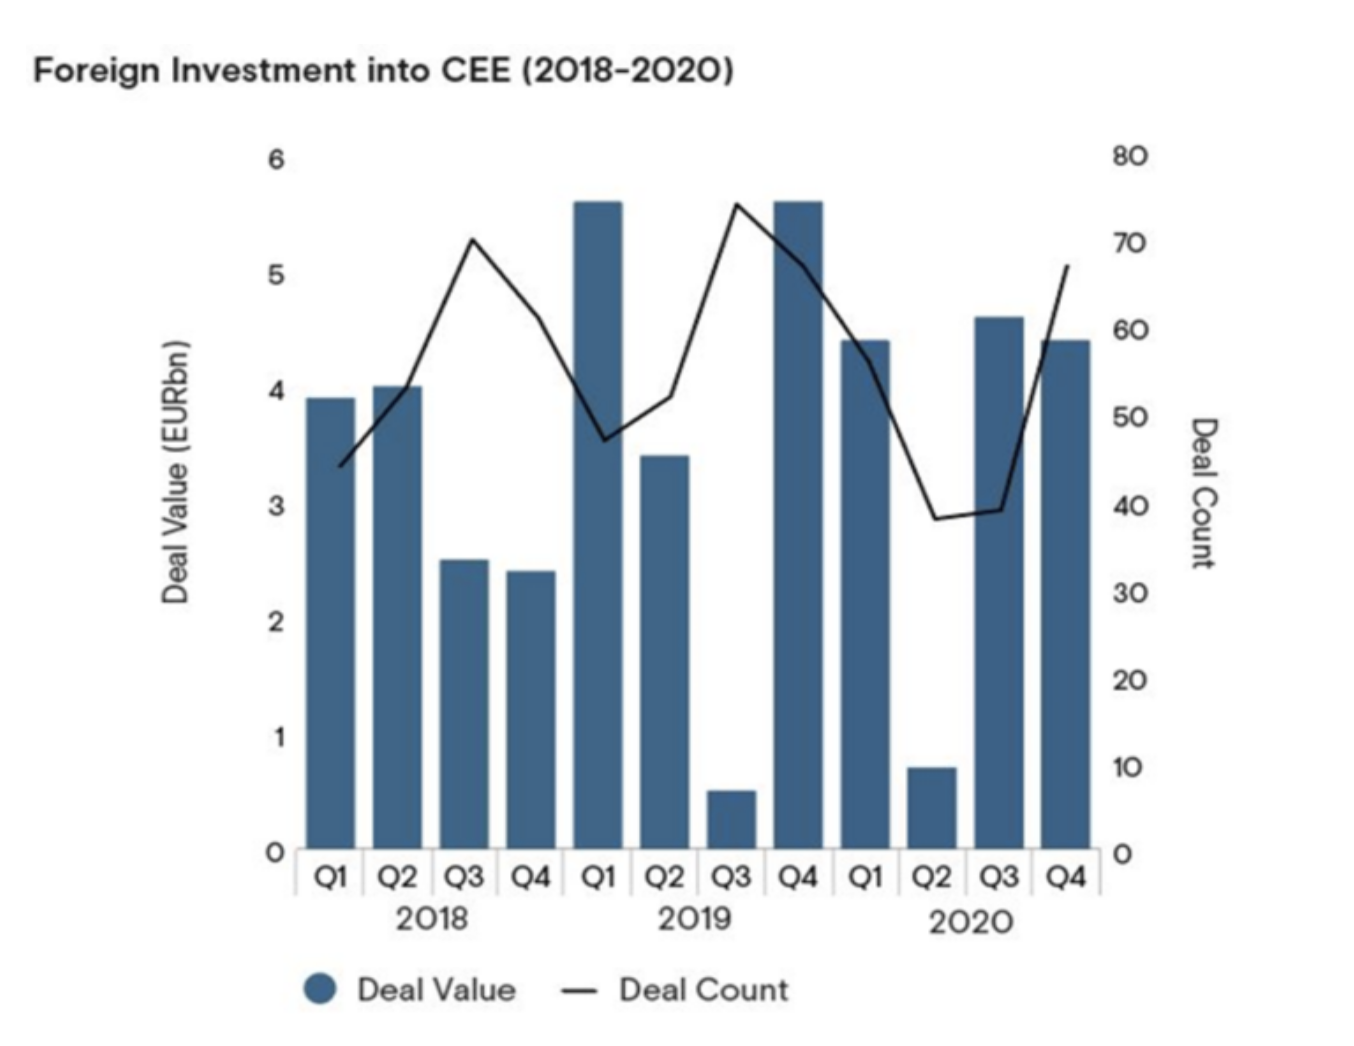
Indeed, inbound investments accounted for a 69.8% share of the market by value in 2020. Inbound investments were mainly driven by the US, France, Netherlands and Austria7.
(b) M&A Performance by Sector
The impact of covid-19 has not been the same for all industries. Some sectors have experienced a boom during the crisis and the trend is likely to continue for 2021; other sectors declined and are unlikely to return to normal activity for some time.
Exhibit 5: CEE sectors by deal value and volume in 202089
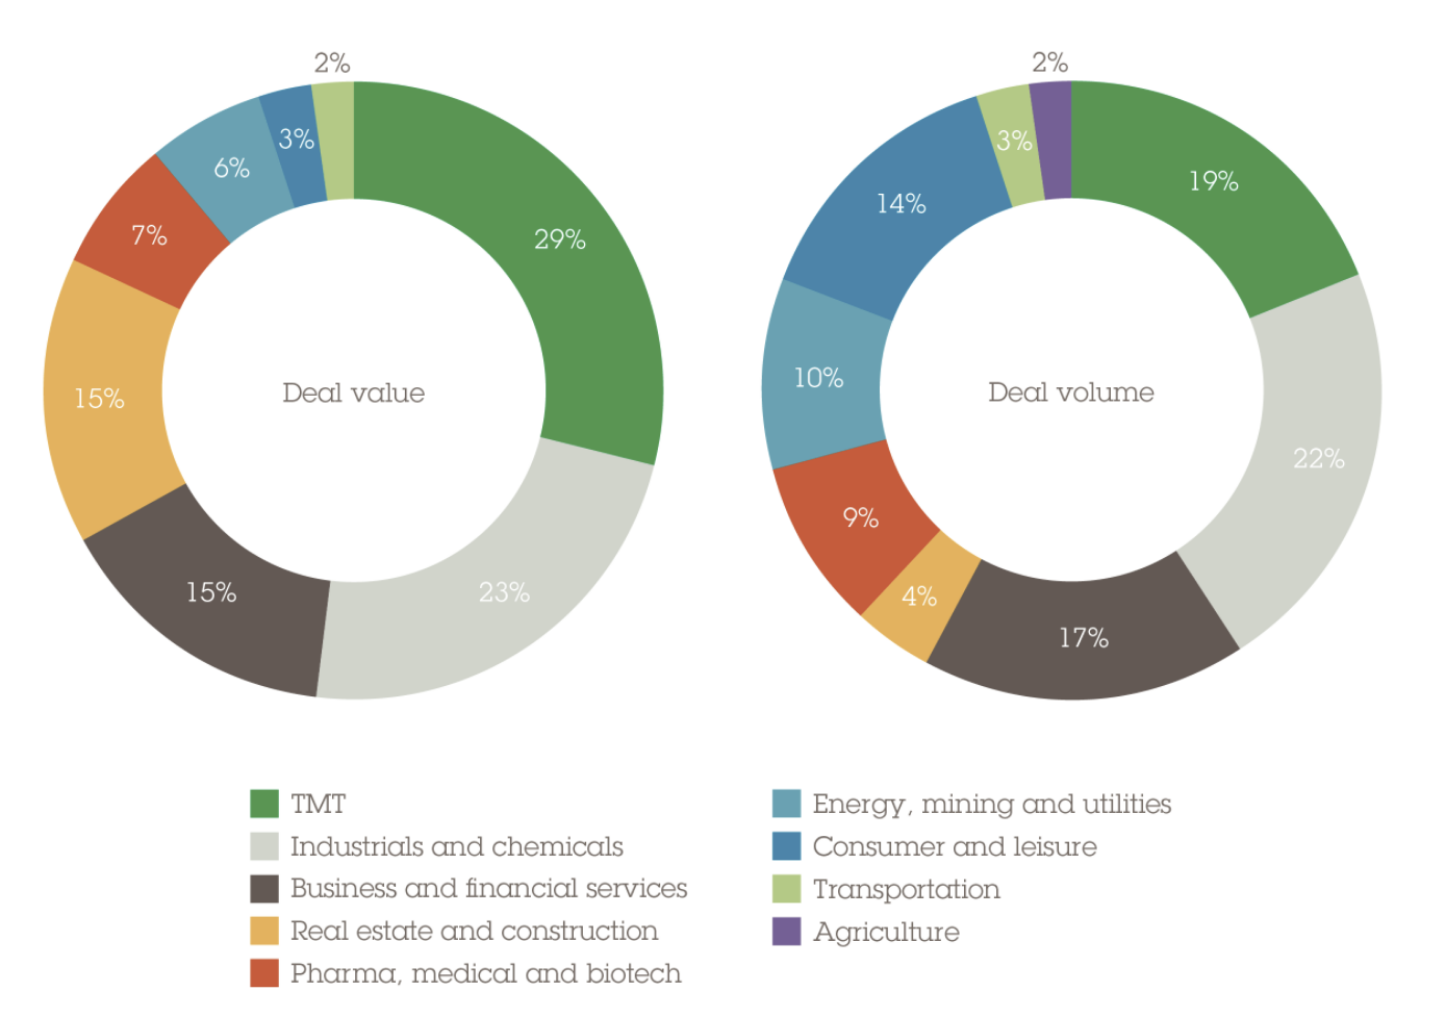
Exhibit 6: Percent Change of M&A activity between 2019 and 2020 by industry in CEE countries10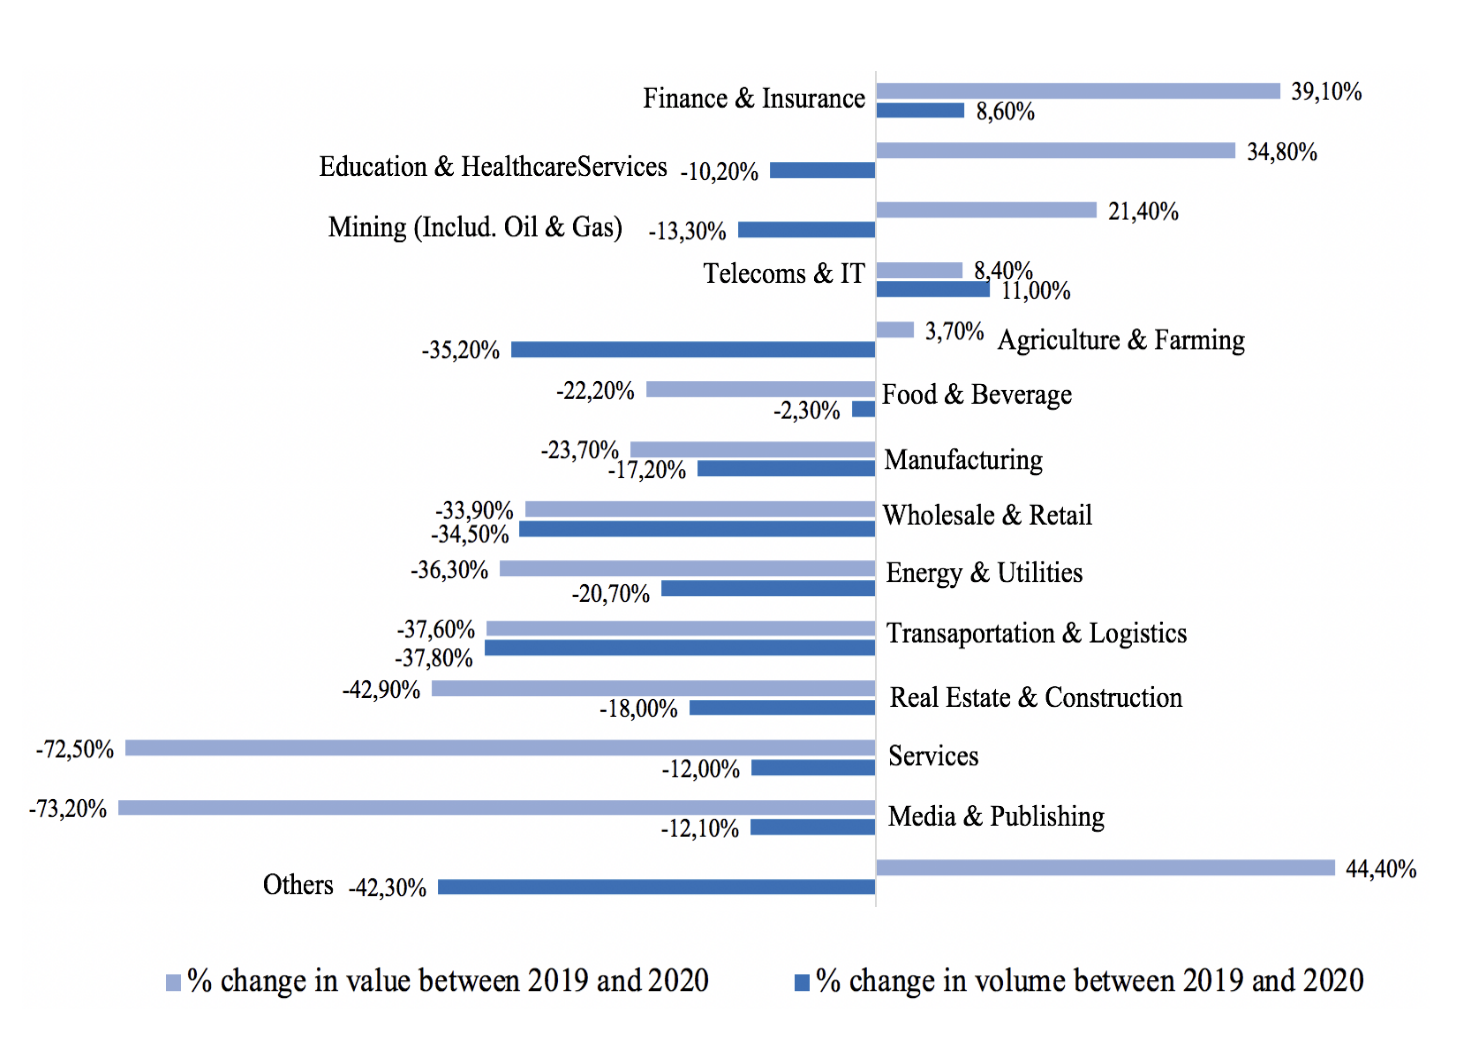 The majority of M&A activity seems to have occurred in the following industries: Telecom Media and Technology (TMT), Industrials and chemicals, Business and Financial services and Real Estate and Construction.
On the contrary, the Agriculture and Transportation industries have suffered a lot during this period with a decrease in deal volume of 35,2 % and 37,8 % respectively compared to 2019. 10
(c) M&A Valuations Trends
While Enterprise Value/EBITDA multiples have declined in Western Europe over the past few years, they have improved, despite Covid-19, in Central Europe. Although the gap has narrowed, it has not been completely eliminated.
Exhibit 7: Median EV/EBITDA Multiple for CEE and the Rest of Europe between 2016 and 20201112
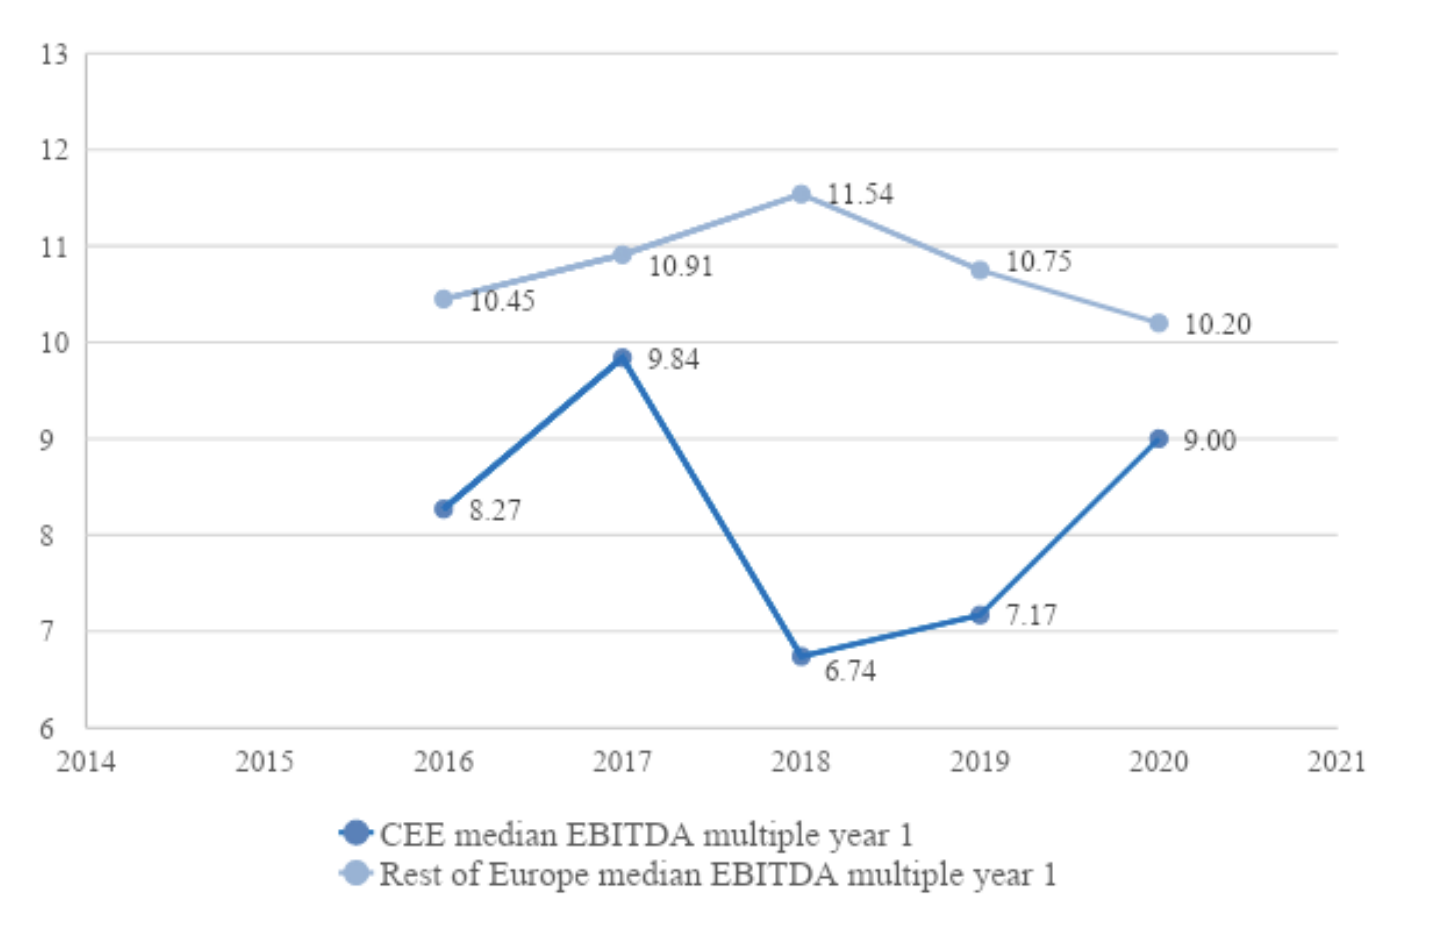
Across Europe, the healthcare and pharmaceuticals sector had the highest median valuation in 2019-20, standing at 15.34x, followed by real estate at 14.39x, and technology at 13.98x. At the lower end of the valuation scale was energy and utilities, with an EV/ EBITDA multiple of just 6.85x, followed by 7.69x for both construction and transport and logistics13.
In conclusion, it appears that purchasers and sellers of companies seemed to have learned a great deal about how to cope with the pandemic after the initial shock of Q2 2020. Zoom meetings and virtual data rooms are now practically universal. It will be interesting to observe whether the current radical peaks of Covid-19 in countries like Hungary and Slovakia will be reflected in the statistics that emerge.
(a) M&A Performance by Geographic Area
While M&A experienced a “near death” experience worldwide in Q2 2020, by Q4, M&A activity even exceeded pre-pandemic levels:
Exhibit 1: M&A activity by value from Q1 2019 to Q4 2020 worldwide1
 The value of M&A transactions in Central Europe (excluding Russia) increased by 28% in 2020 over 2019. As the Exhibit below demonstrates, Central Europe was the only geographic area in the world where an increase in value of transactions was observable:
Exhibit 2: Percent Rise/Fall in value of deals involving targets in region (H1 2019 vs H1 2020)2
 It should be noted that during this time frame, global volume of transactions decreased by 7% and the number of transactions in Central Europe decreased 28%3.
As the graph below demonstrates, even on a population-adjusted basis, Poland and Czech Republic by far outperformed Hungary and Slovakia.
Exhibit 3: M&A activity in volume and in value for the V44 Countries in 20205
 In Poland, value of transactions rose 41% to €11.2bn from 2019 to 2020, despite Covid, though the number of transactions fell from 154 to 124 during the same period.
For the other three Visegrád countries there was a sharp decline in both volume and number of transactions.
Exhibit 4: Degree to which foreign investment was responsible for inbound M&A activity in Central Europe6

Indeed, inbound investments accounted for a 69.8% share of the market by value in 2020. Inbound investments were mainly driven by the US, France, Netherlands and Austria7.
(b) M&A Performance by Sector
The impact of covid-19 has not been the same for all industries. Some sectors have experienced a boom during the crisis and the trend is likely to continue for 2021; other sectors declined and are unlikely to return to normal activity for some time.
Exhibit 5: CEE sectors by deal value and volume in 202089

Exhibit 6: Percent Change of M&A activity between 2019 and 2020 by industry in CEE countries10
 The majority of M&A activity seems to have occurred in the following industries: Telecom Media and Technology (TMT), Industrials and chemicals, Business and Financial services and Real Estate and Construction.
On the contrary, the Agriculture and Transportation industries have suffered a lot during this period with a decrease in deal volume of 35,2 % and 37,8 % respectively compared to 2019. 10
(c) M&A Valuations Trends
While Enterprise Value/EBITDA multiples have declined in Western Europe over the past few years, they have improved, despite Covid-19, in Central Europe. Although the gap has narrowed, it has not been completely eliminated.
Exhibit 7: Median EV/EBITDA Multiple for CEE and the Rest of Europe between 2016 and 20201112

Across Europe, the healthcare and pharmaceuticals sector had the highest median valuation in 2019-20, standing at 15.34x, followed by real estate at 14.39x, and technology at 13.98x. At the lower end of the valuation scale was energy and utilities, with an EV/ EBITDA multiple of just 6.85x, followed by 7.69x for both construction and transport and logistics13.
In conclusion, it appears that purchasers and sellers of companies seemed to have learned a great deal about how to cope with the pandemic after the initial shock of Q2 2020. Zoom meetings and virtual data rooms are now practically universal. It will be interesting to observe whether the current radical peaks of Covid-19 in countries like Hungary and Slovakia will be reflected in the statistics that emerge.
1MergerMarket
2Bloomberg
3https://members.mergermarket.com/cee-ma-overview-overcoming-covid-19-and-hope-for-the-future
4V4 Countries = Visegrád Group (Czech Republic, Hungary, Poland and Slovakia)
5CMS – Emerging Europe M&A Report 2020/2021
6MergerMarket
7https://members.mergermarket.com/cee-ma-overview-overcoming-covid-19-and-hope-for-the-future
8MergerMarket
9TMT = Technology, Media & Telecom
10CMS – Emerging Europe M&A Report 2020/2021
11MergerMarket
12Median EBITDA multiples only given for sectors with 25 or more reported EBITDA multiples in 2019 and 2020. Rest of Europe includes: Andorra, Belgium, Channel Islands, Cyprus, Denmark, Faroe Islands, Finland, France, Germany, Gibraltar, Greece, Iceland, Ireland, Isle of Man, Italy, Liechtenstein, Luxembourg, Malta, Monaco, Netherlands, Norway, Portugal, San Marino, Spain, Sweden, Switzerland, United Kingdom.
13https://www.mergermarket.com/assets/Clearwater_Multiples_Q42020_final.pdf