Inflation does not affect emerging markets (EM’s) the same way as developing markets (DM’s). In this article, we examine (a) past and current differences in inflation rates between emerging and developed markets; (b) differences in performance among asset classes between emerging and developed markets during times of inflation; and (c) a discussion on Central Europe.
a, Past and current differences in inflation rates between emerging and developed markets
During the past 25 years, inflation in EM’s has been consistently higher than in DM’s, with much higher inflation in EM’s during two periods, from 1994 to 2000 and from 2018 to 2020.
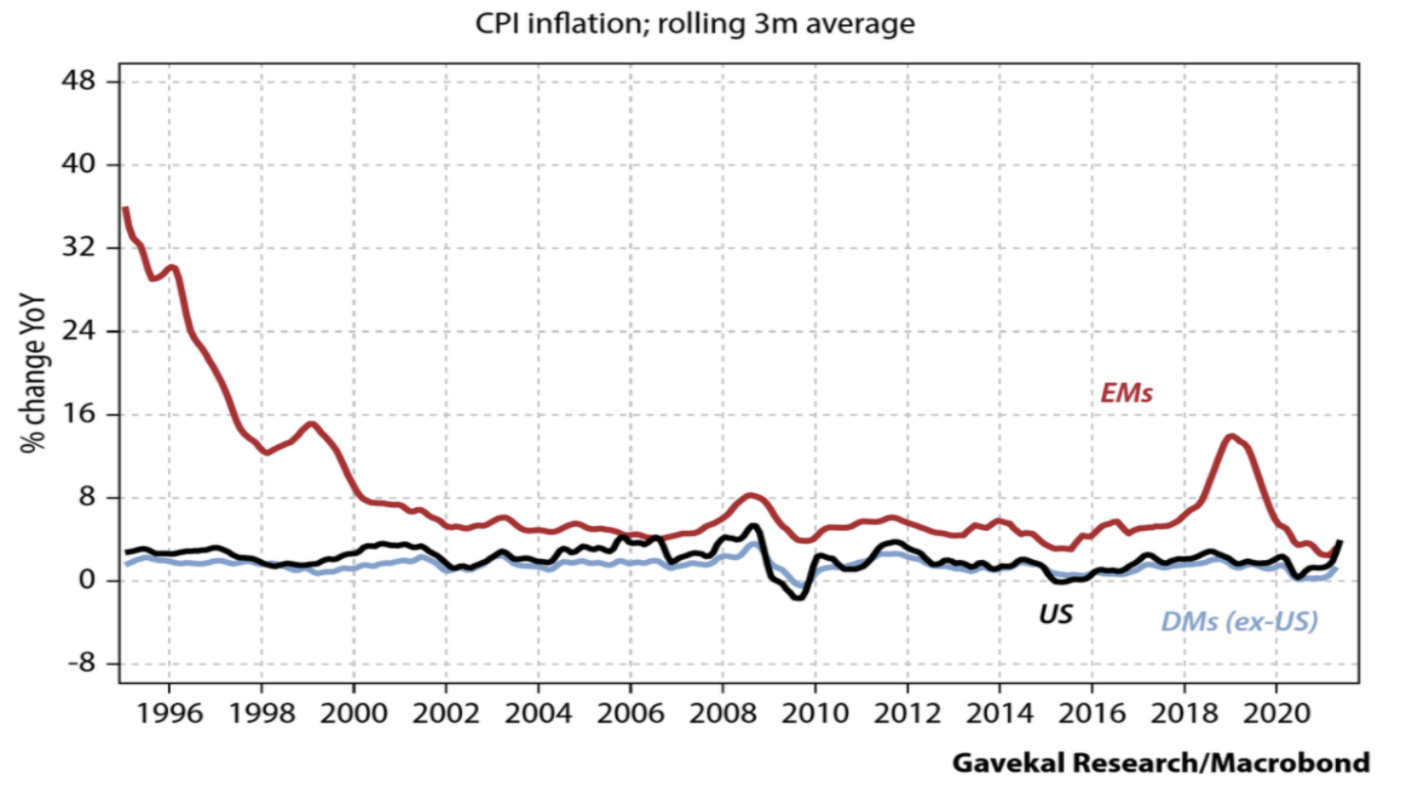
The reader may notice on the above graph, US inflation has begun to outpace inflation across most DM’s in 2021, reaching levels experienced in EM’s, indicating an overheating of the US economy, fuelled by monetary and fiscal stimulus.
Of course, if one looks at inflation on a country-by-country basis, results are more scattered, but the trend is upwards everywhere:
Exhibit 2: Monthly inflation rates in developed and emerging countries from July 2018 to May 2021 (compared to the same month of the previous year)1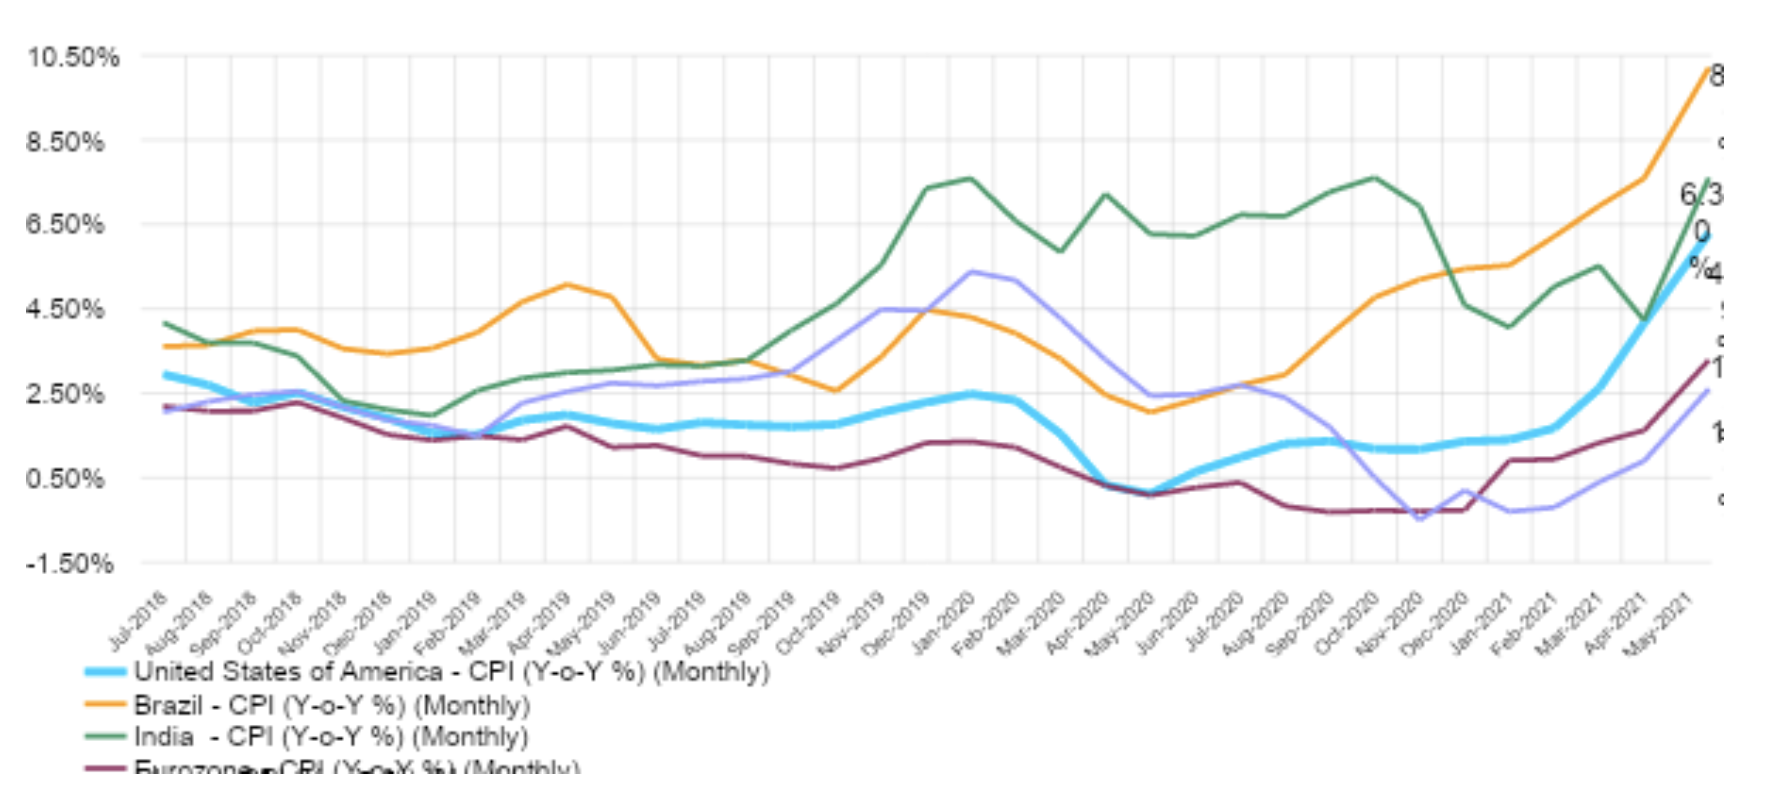 Inflation in EM’s may have a much more disastrous impact than in DM’s. For example, the Arab Spring in 2011 was triggered by rapid inflation, particularly in the price of wheat.
b, Differences in performance among asset classes between EM’s and DM’s during times of inflation
Compared to other assets classes, EM equities are among the best performers in periods of high inflation and strong growth. From 1987 to 2021, when global inflation was above 2%, EM equities were significant outperformers, generating average annual returns of almost 27%.
Exhibit 3: Average annual total percentage returns of different assets classes when inflation is above/below 2%, from 1987 to 20202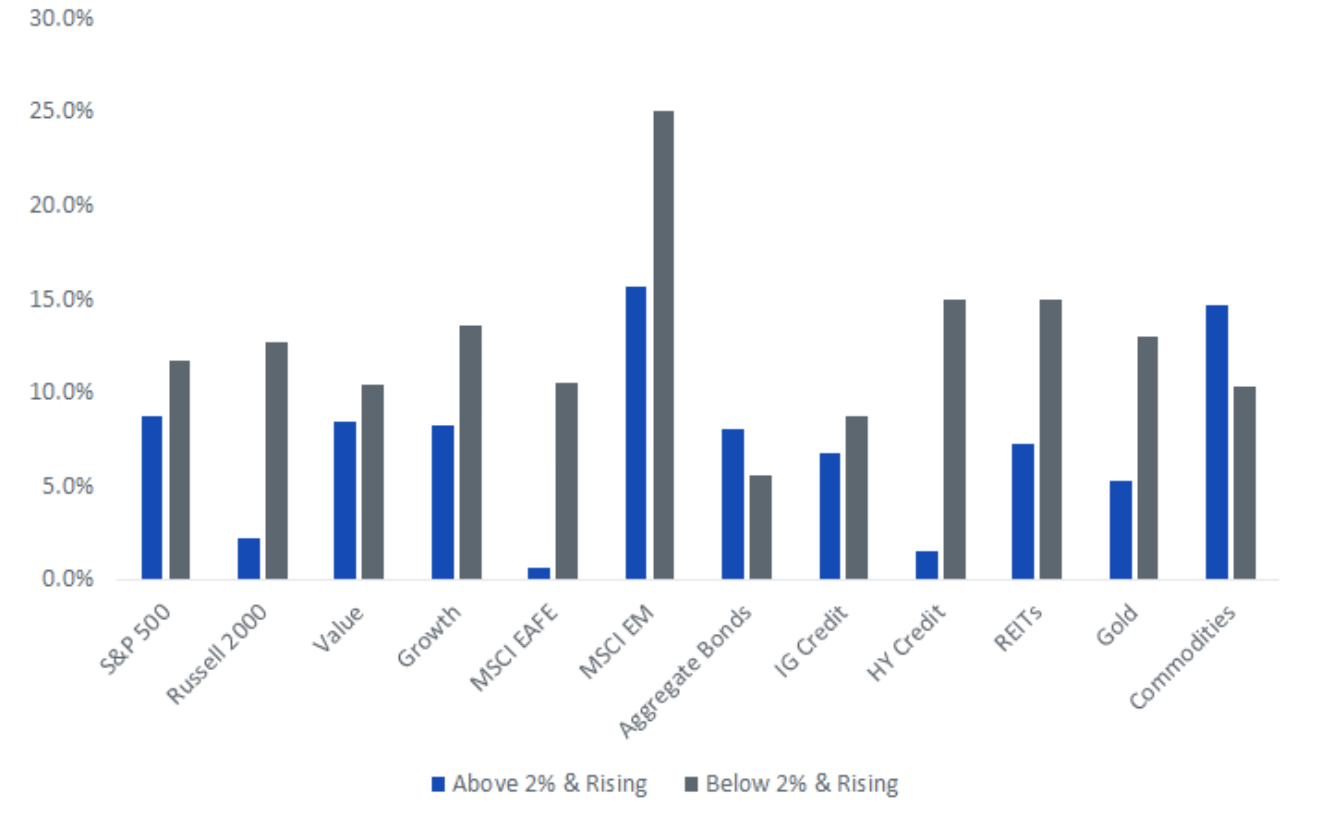 After a Covid-induced 2020 recession that was less severe in EM’s than DM’s in terms of GDP impact, EM GDP growth is once again expected to outpace DM growth, beginning with expectations for a robust recovery in 2021:
Exhibit 4: GDP Annual Growth in EM’s and DM’s, with IMF Forecasts for 2021-2025535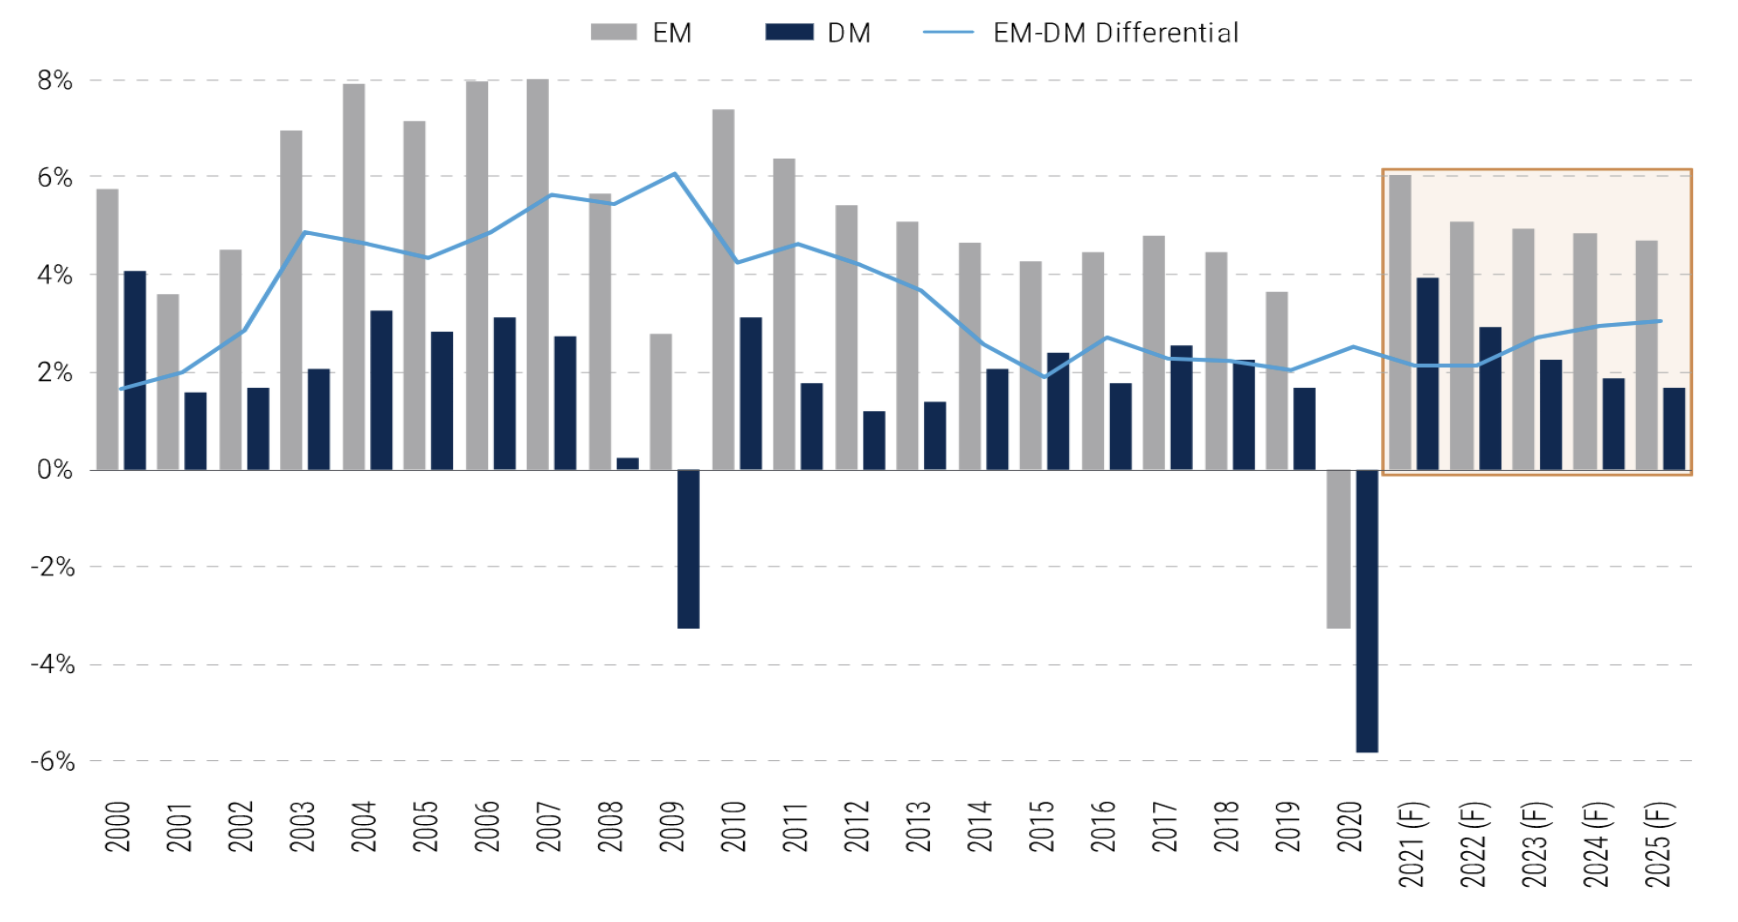 Outperformance of Emerging Market assets may also be explained by the fact that EM’s do better in time of weakening US dollars. EM’s tend to issue U.S. dollar- denominated debt; when the USD appreciates, more local currency is required to service debt, putting a drag on the economy and increasing probability of default. The graph below demonstrates the inverse relationship between EM equities and the USD:
Exhibit 5: Performance of EM’s compared to the U.S. Dollar, 1995 to 20204 c, A discussion on Central Europe
As of April 2021, Central European inflation rates are among the top in the EU. Hungary, Poland and Czechia are experiencing inflation rates of 5,2%; 5,1% and 3,1% respectively.
Exhibit 6: European countries annual inflation rates (%) as at April 2021262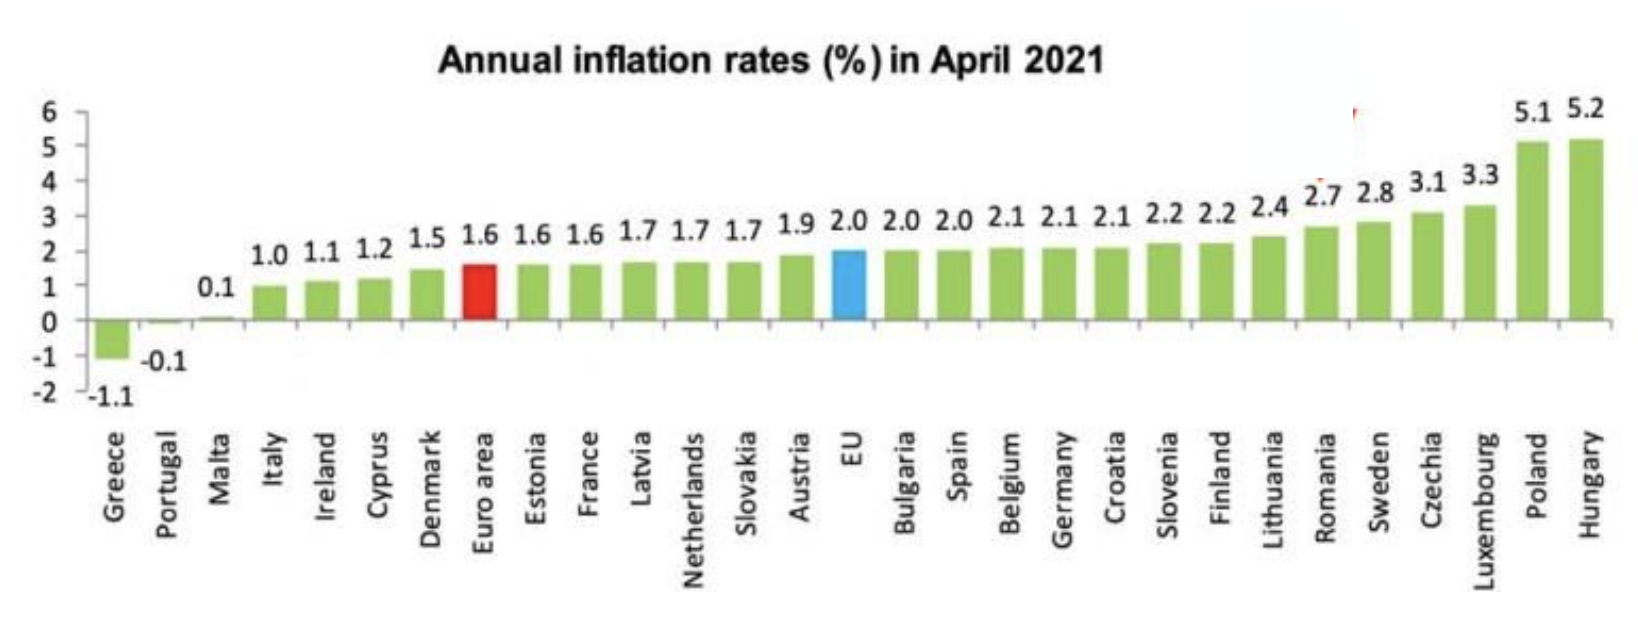 In Hungary, inflation recently reached an annual rate of 5.1%, above the National Bank 3% headline inflation target.3 It is the highest inflation rate since November 2012. Emerging markets do not have the luxury of allowing their economies and inflation rates to “run hot”; Brazil and Hungary have raised borrowing costs. The Monetary Council of the Hungarian National Bank (MNB) raised the base rate by 30bp to 0.90% at a monthly policy meeting on June 22 of this year.
Exhibit 7: Hungary Interest Rate from 2011 to 2021686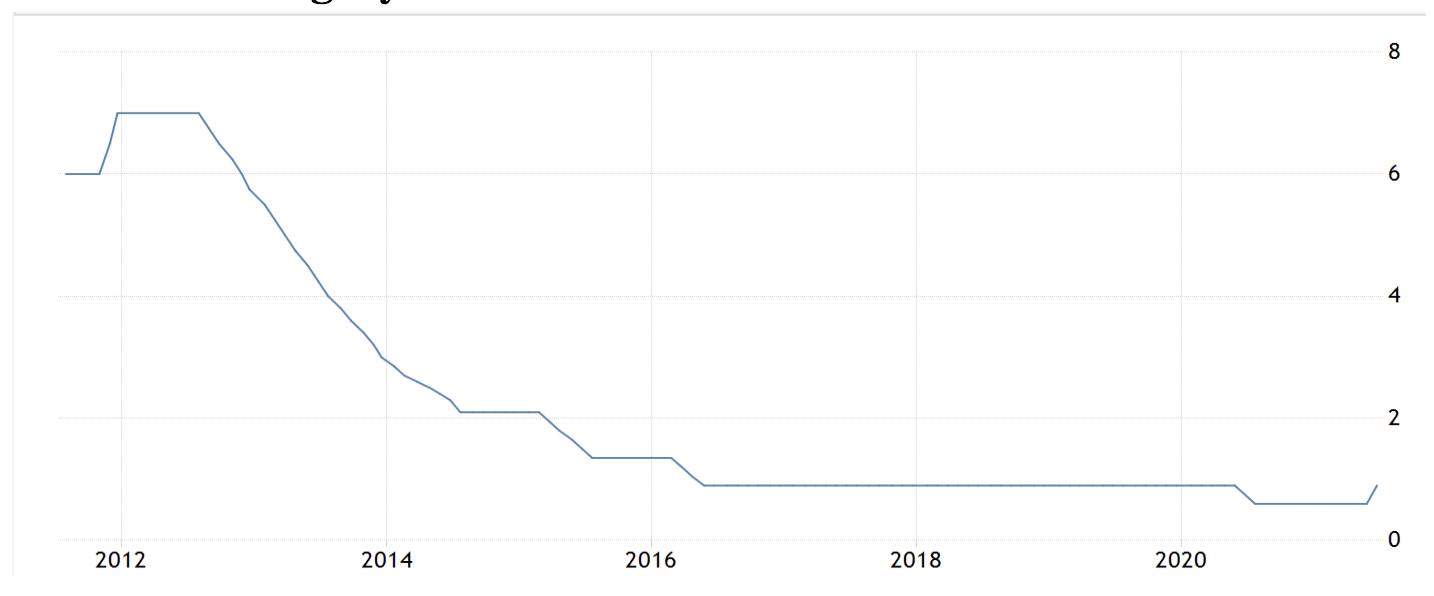 Similarly, the Czech central bank increased its key interest rate by a quarter-point to 0.5% in an effort to tame inflation, as the economy recovers from the coronavirus pandemic.
Conclusion
Similarly, the Czech central bank increased its key interest rate by a quarter-point to 0.5% in an effort to tame inflation, as the economy recovers from the coronavirus pandemic.
Conclusion
EM’s have been a relatively better investment than DM’s over the years, whether you invested in equity or in debt. But it is important to bear in mind that EM’s will generally be subject to greater political, legal, counterparty and operational risks.
Exhibit 8: Historical returns and volatility from end 1999 to 20189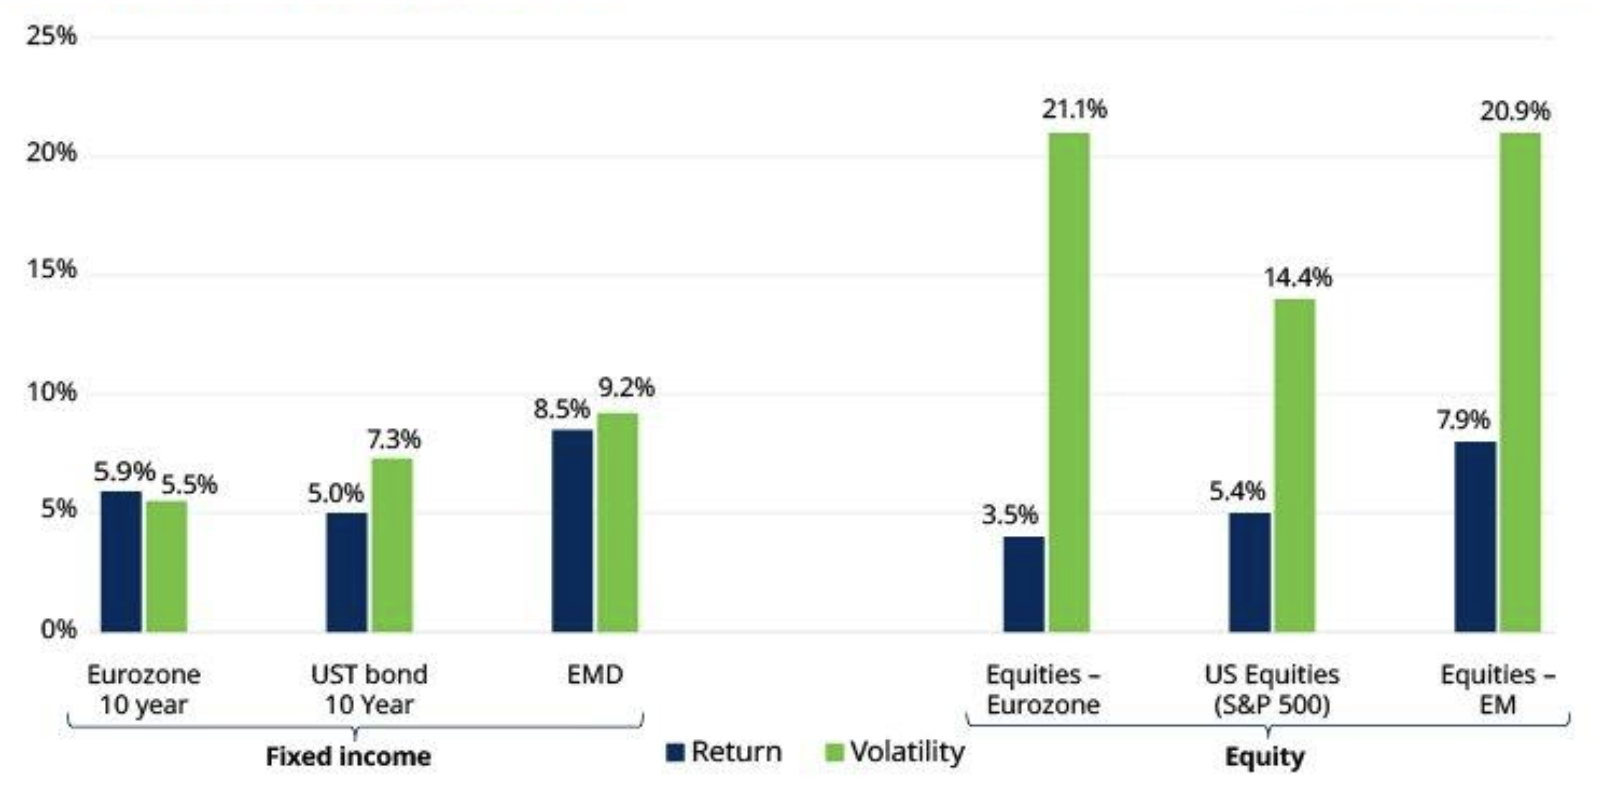 The above chart demonstrates that both returns and volatility in EM’s has been relatively high over the past 20 years.
In term of country, in 2020 the 5 best emerging market equity performers were Korea (44,64%), Taiwan (40,99%), China (29,49%), India (15,55%) and Argentina (12,7%).
It goes to show that investments in EM’s have a place in any portfolio, and particularly during a time of accelerating inflation. The choice of country, debt or equity, and company issuing the debt or equity remain key questions.
a, Past and current differences in inflation rates between emerging and developed markets
During the past 25 years, inflation in EM’s has been consistently higher than in DM’s, with much higher inflation in EM’s during two periods, from 1994 to 2000 and from 2018 to 2020.
The reader may notice on the above graph, US inflation has begun to outpace inflation across most DM’s in 2021, reaching levels experienced in EM’s, indicating an overheating of the US economy, fuelled by monetary and fiscal stimulus.
Of course, if one looks at inflation on a country-by-country basis, results are more scattered, but the trend is upwards everywhere:
Exhibit 2: Monthly inflation rates in developed and emerging countries from July 2018 to May 2021 (compared to the same month of the previous year)1
Inflation in EM’s may have a much more disastrous impact than in DM’s. For example, the Arab Spring in 2011 was triggered by rapid inflation, particularly in the price of wheat.
b, Differences in performance among asset classes between EM’s and DM’s during times of inflation
Compared to other assets classes, EM equities are among the best performers in periods of high inflation and strong growth. From 1987 to 2021, when global inflation was above 2%, EM equities were significant outperformers, generating average annual returns of almost 27%.
Exhibit 3: Average annual total percentage returns of different assets classes when inflation is above/below 2%, from 1987 to 20202
After a Covid-induced 2020 recession that was less severe in EM’s than DM’s in terms of GDP impact, EM GDP growth is once again expected to outpace DM growth, beginning with expectations for a robust recovery in 2021:
Exhibit 4: GDP Annual Growth in EM’s and DM’s, with IMF Forecasts for 2021-2025535
Outperformance of Emerging Market assets may also be explained by the fact that EM’s do better in time of weakening US dollars. EM’s tend to issue U.S. dollar- denominated debt; when the USD appreciates, more local currency is required to service debt, putting a drag on the economy and increasing probability of default. The graph below demonstrates the inverse relationship between EM equities and the USD:
Exhibit 5: Performance of EM’s compared to the U.S. Dollar, 1995 to 20204
c, A discussion on Central Europe
As of April 2021, Central European inflation rates are among the top in the EU. Hungary, Poland and Czechia are experiencing inflation rates of 5,2%; 5,1% and 3,1% respectively.
Exhibit 6: European countries annual inflation rates (%) as at April 2021262
In Hungary, inflation recently reached an annual rate of 5.1%, above the National Bank 3% headline inflation target.3 It is the highest inflation rate since November 2012. Emerging markets do not have the luxury of allowing their economies and inflation rates to “run hot”; Brazil and Hungary have raised borrowing costs. The Monetary Council of the Hungarian National Bank (MNB) raised the base rate by 30bp to 0.90% at a monthly policy meeting on June 22 of this year. Exhibit 7: Hungary Interest Rate from 2011 to 2021686
Similarly, the Czech central bank increased its key interest rate by a quarter-point to 0.5% in an effort to tame inflation, as the economy recovers from the coronavirus pandemic.
Conclusion
EM’s have been a relatively better investment than DM’s over the years, whether you invested in equity or in debt. But it is important to bear in mind that EM’s will generally be subject to greater political, legal, counterparty and operational risks.
Exhibit 8: Historical returns and volatility from end 1999 to 20189
The above chart demonstrates that both returns and volatility in EM’s has been relatively high over the past 20 years.
In term of country, in 2020 the 5 best emerging market equity performers were Korea (44,64%), Taiwan (40,99%), China (29,49%), India (15,55%) and Argentina (12,7%).
It goes to show that investments in EM’s have a place in any portfolio, and particularly during a time of accelerating inflation. The choice of country, debt or equity, and company issuing the debt or equity remain key questions.
1https://www-statista-com.grenoble-em.idm.oclc.org/statistics/1034154/monthly-inflation-rates-developed-emerging-countries/
2https://seekingalpha.com/article/4415501-dusting-off-the-inflation-playbook
35IMF
4Bloomberg
62Eurostat
73https://www.reuters.com/article/easteurope-economy-idUSL5N2NR1MC
86https://tradingeconomics.com/hungary/interest-rate#:~:text=Looking%20forward%2C%20we%20estimate%20Interest,according%20to%20our%20econometric%20models.
9Schroders