This is the first of a series of articles on asset classes. Whether you are an individual managing a portfolio for retirement, or someone who just sold their business and devising a strategy to invest funds, the choice of asset classes will be the most fundamental investment decision you make in designing your portfolio.
In our M&A business, we have come across many business owners who choose not to sell their businesses, because they do not believe they can achieve decent returns. Often they hold onto their businesses longer than age-associate risks would justify. Others might not be that advanced in age, but would prefer sell their business and enjoy life, yet cannot bring themselves to sell their businesses because they do not have confidence in their ability to create a portfolio which generates a decent return. In the past years, there have been numerous articles about how we are in a “low yield” environment. The good news is that it should be possible to create a portfolio that brings a decent return over the long-term.
Once you accumulate capital, however modest in amount, put your capital to work!
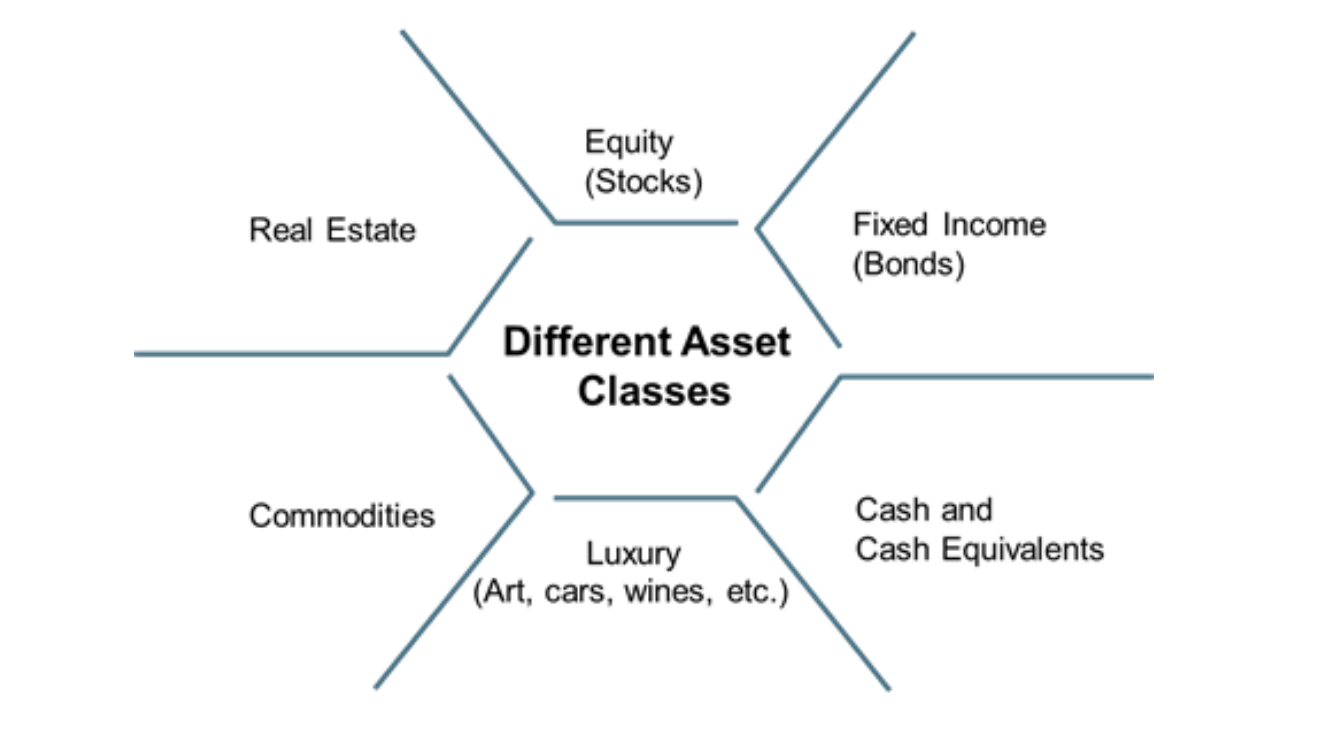
This first article of the series is designed to provide an overview on the subject of different asset classes; subsequent articles will go into more detail on each individual asset classes—e.g. bonds, equities, real estate, luxury goods, etc.
The choice of asset classes is not a ‘one size fits all” decision. The decision should ideally be tailored to each portfolio:
 For the remainder of this article, we will analyze asset class allocation from the perspective of (a) liquidity; (b) risk return ratios;
(a) Liquidity
You should always have enough cash or cash equivalents on hand to cover expenses and contingencies (e.g. hospitalization) in the short- to medium-term.
According to Society of Actuaries, liquidity is a measure of how quickly you can sell something without impacting the price1. Real estate and cash lies on opposite parts of illiquid-liquid spectrum (Please see Exhibit 2). Real estate investments and alternative investments often have a lower level of liquidity because of their nature, they are real, tangible assets. It can take many months to sell such assets at acceptable price. On the other hand, certain types of real and other tangible assets may arguably be less volatile than financial assets (bonds and stocks), hence may serve to balance a portfolio.
Exhibit 2: Illiquid-Liquid Spectrum
For the remainder of this article, we will analyze asset class allocation from the perspective of (a) liquidity; (b) risk return ratios;
(a) Liquidity
You should always have enough cash or cash equivalents on hand to cover expenses and contingencies (e.g. hospitalization) in the short- to medium-term.
According to Society of Actuaries, liquidity is a measure of how quickly you can sell something without impacting the price1. Real estate and cash lies on opposite parts of illiquid-liquid spectrum (Please see Exhibit 2). Real estate investments and alternative investments often have a lower level of liquidity because of their nature, they are real, tangible assets. It can take many months to sell such assets at acceptable price. On the other hand, certain types of real and other tangible assets may arguably be less volatile than financial assets (bonds and stocks), hence may serve to balance a portfolio.
Exhibit 2: Illiquid-Liquid Spectrum
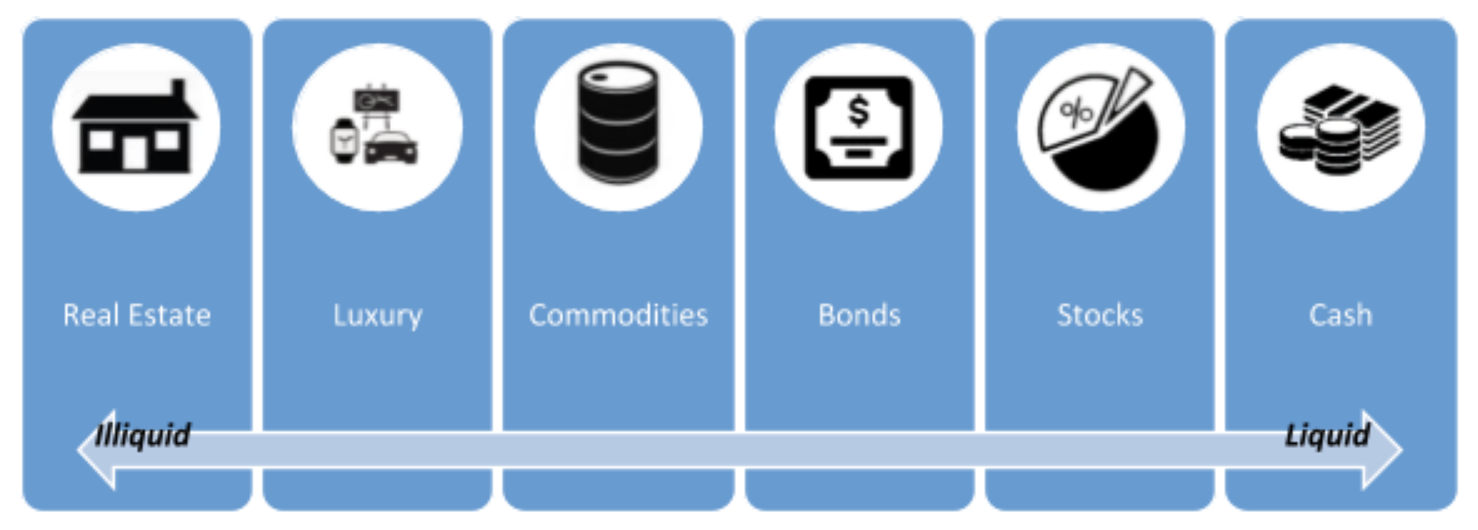 Please note that the above classification is very general and as with French verbs, there are exceptions to every rule. For example, certain rarely traded stocks, may be considerably less liquid than gold coin. Shares in private companies (e.g. not listed on a stock exchange) are extremely illiquid! In most cases even less liquid than real estate!
(b) Risk-return ratio
There is a general principle in finance that risk and return are directly proportional. In other words, the higher the return, the higher the associated risk. According to the efficient market hypothesis, one of the most fundamental principals of finance, is that all information known about a particular stock or investment is already built into the price of that stock or investment.
There has been a multi-decade raging debate in finance about whether the efficient market hypothesis really applies. My own feeling is that it provides general guidance, but there is a tendency for investors to follow each other—you might call it the “lemming effect”. Hence there may be a tendency for bull markets (as well as bear markets) to perpetuate themselves.
Once in a while, there may also be an “outlier” which the market misses, or barriers to entry create an aberration. For example, in 2001 one of the authors of this article invested in land in Hungary that was 2 km from the Austrian border. Equivalent land on the other side of the border was trading at 8x the per hectare price—potentially offering a very high return, as prices converge with Austrian land prices, with very low downside risk. (The land was sold in 2013 at over 10x the purchase price). Granted, those types of “outliers” cannot be found every day.
One might subdivide assets into two main categories:
Please note that the above classification is very general and as with French verbs, there are exceptions to every rule. For example, certain rarely traded stocks, may be considerably less liquid than gold coin. Shares in private companies (e.g. not listed on a stock exchange) are extremely illiquid! In most cases even less liquid than real estate!
(b) Risk-return ratio
There is a general principle in finance that risk and return are directly proportional. In other words, the higher the return, the higher the associated risk. According to the efficient market hypothesis, one of the most fundamental principals of finance, is that all information known about a particular stock or investment is already built into the price of that stock or investment.
There has been a multi-decade raging debate in finance about whether the efficient market hypothesis really applies. My own feeling is that it provides general guidance, but there is a tendency for investors to follow each other—you might call it the “lemming effect”. Hence there may be a tendency for bull markets (as well as bear markets) to perpetuate themselves.
Once in a while, there may also be an “outlier” which the market misses, or barriers to entry create an aberration. For example, in 2001 one of the authors of this article invested in land in Hungary that was 2 km from the Austrian border. Equivalent land on the other side of the border was trading at 8x the per hectare price—potentially offering a very high return, as prices converge with Austrian land prices, with very low downside risk. (The land was sold in 2013 at over 10x the purchase price). Granted, those types of “outliers” cannot be found every day.
One might subdivide assets into two main categories:
 Once again, the above exhibit should be taken with a big grain of salt. For example does a Real Estate Investment Trust (REIT) have more the characteristics of risk/return of real estate or stocks?
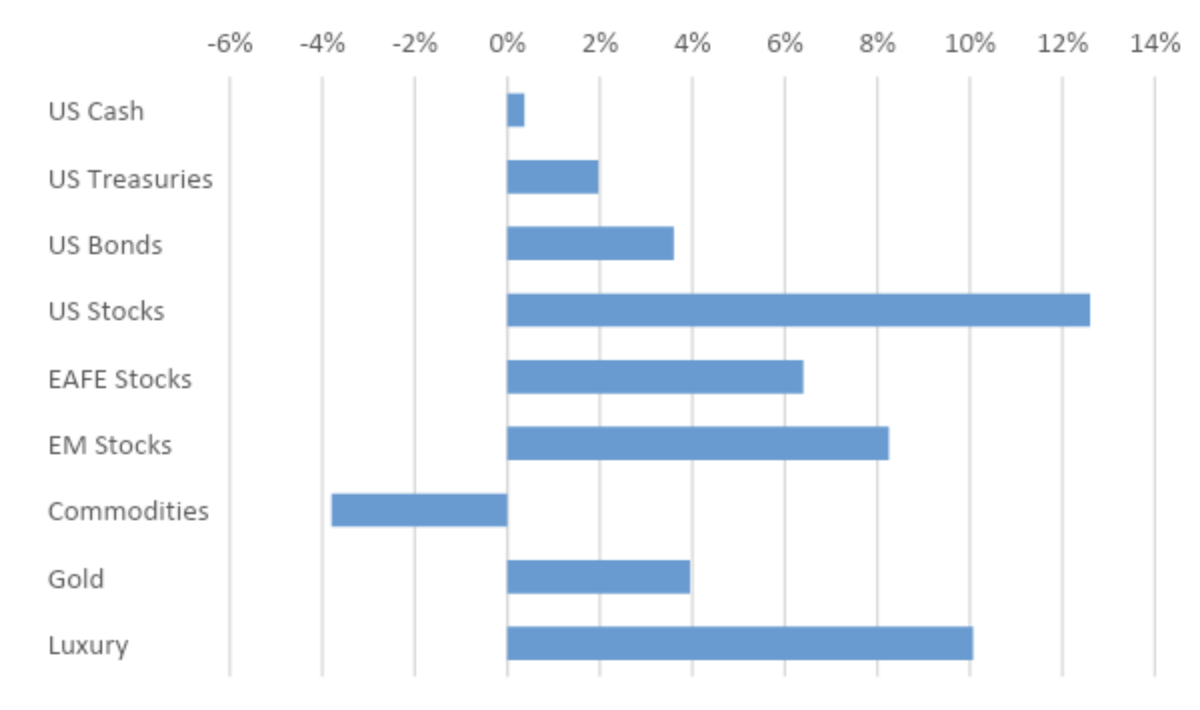
The next three charts show indicative rates of returns over the past 1, 10 and 20 years for different asset classes:
Exhibit 4: Total returns for different asset classes for 2018, %2
Once again, the above exhibit should be taken with a big grain of salt. For example does a Real Estate Investment Trust (REIT) have more the characteristics of risk/return of real estate or stocks?
The next three charts show indicative rates of returns over the past 1, 10 and 20 years for different asset classes:
Exhibit 4: Total returns for different asset classes for 2018, %2
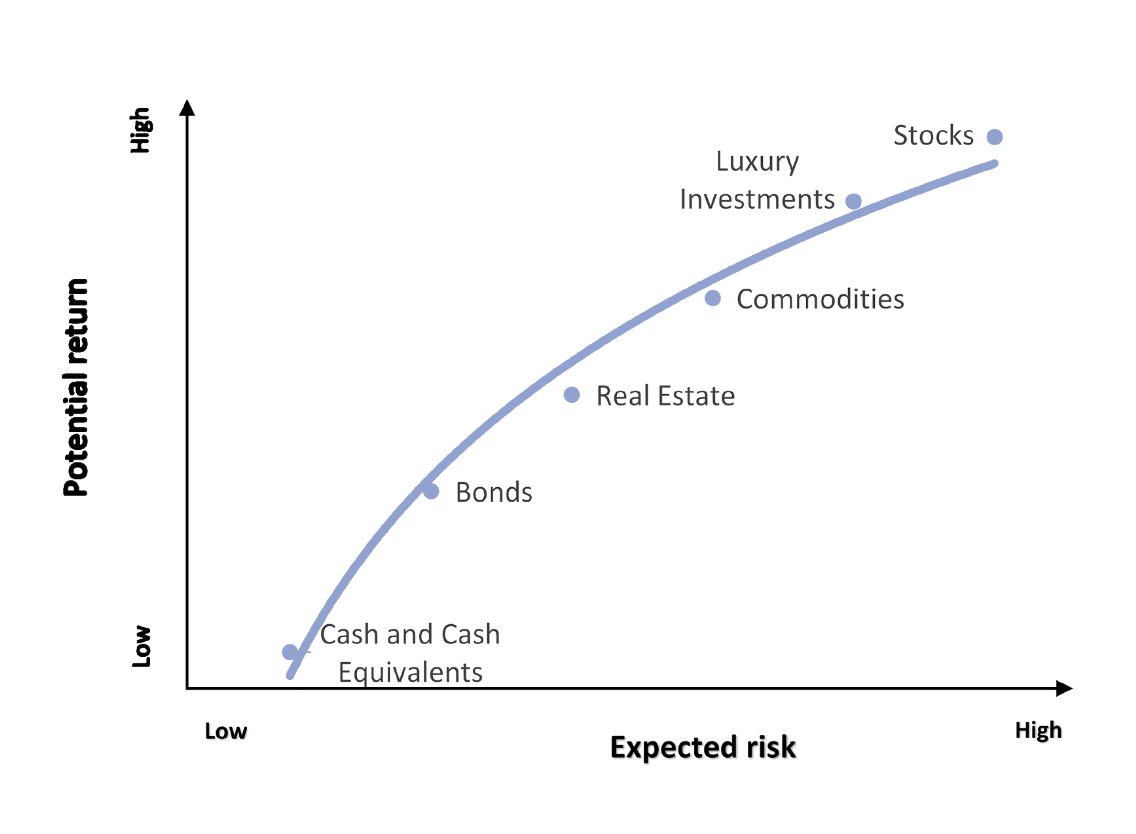 Exhibit 5: Compounded annual growth rate for different asset classes for 10-year, %3
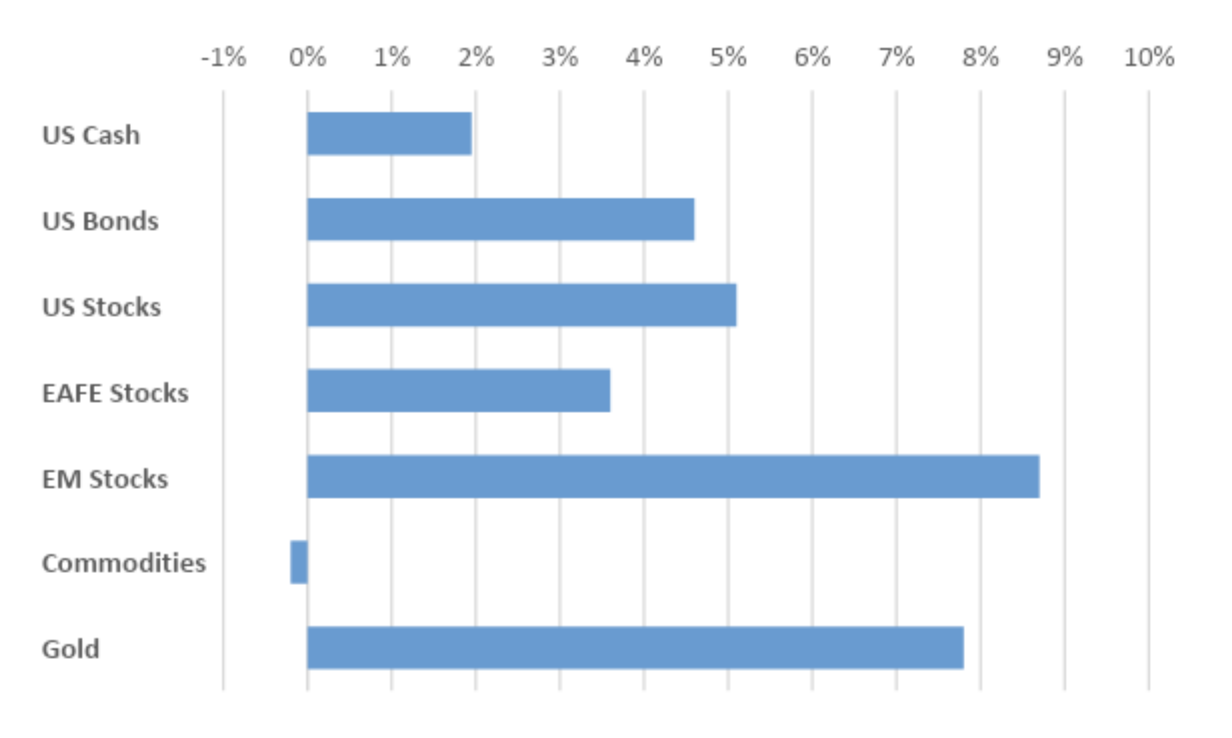 Exhibit 6: Compounded annual growth rate for different asset classes for 20-year, %4
 As can be seen, returns among asset classes vary widely over the decades. This is one reason why diversification among asset classes is so important.
Subsequent articles in this series on asset classes will be structured as follows:
As can be seen, returns among asset classes vary widely over the decades. This is one reason why diversification among asset classes is so important.
Subsequent articles in this series on asset classes will be structured as follows:
- Your return expectations (what kind of a return do you need to achieve goals, for example, a satisfactory retirement nest egg?)
- Your investment time horizon (e.g. how long to retirement?),
- Your risk profile (what degree of risk can you tolerate in your portfolio?),
- Liquidity (how much cash might you need during your investment time horizon?)
- The tax regime to which you are subject (what is the tax rate on different investments in your jurisdiction?). This may influence the portfolio mix.
- Stocks or equities
- Fixed Income or bonds
- Cash or cash equivalents
- Real estate
- Commodities (sometimes emphasizing gold—see my earlier series on gold)
- Luxury goods (particularly art)
For the remainder of this article, we will analyze asset class allocation from the perspective of (a) liquidity; (b) risk return ratios;
(a) Liquidity
You should always have enough cash or cash equivalents on hand to cover expenses and contingencies (e.g. hospitalization) in the short- to medium-term.
According to Society of Actuaries, liquidity is a measure of how quickly you can sell something without impacting the price1. Real estate and cash lies on opposite parts of illiquid-liquid spectrum (Please see Exhibit 2). Real estate investments and alternative investments often have a lower level of liquidity because of their nature, they are real, tangible assets. It can take many months to sell such assets at acceptable price. On the other hand, certain types of real and other tangible assets may arguably be less volatile than financial assets (bonds and stocks), hence may serve to balance a portfolio.
Exhibit 2: Illiquid-Liquid Spectrum
Please note that the above classification is very general and as with French verbs, there are exceptions to every rule. For example, certain rarely traded stocks, may be considerably less liquid than gold coin. Shares in private companies (e.g. not listed on a stock exchange) are extremely illiquid! In most cases even less liquid than real estate!
(b) Risk-return ratio
There is a general principle in finance that risk and return are directly proportional. In other words, the higher the return, the higher the associated risk. According to the efficient market hypothesis, one of the most fundamental principals of finance, is that all information known about a particular stock or investment is already built into the price of that stock or investment.
There has been a multi-decade raging debate in finance about whether the efficient market hypothesis really applies. My own feeling is that it provides general guidance, but there is a tendency for investors to follow each other—you might call it the “lemming effect”. Hence there may be a tendency for bull markets (as well as bear markets) to perpetuate themselves.
Once in a while, there may also be an “outlier” which the market misses, or barriers to entry create an aberration. For example, in 2001 one of the authors of this article invested in land in Hungary that was 2 km from the Austrian border. Equivalent land on the other side of the border was trading at 8x the per hectare price—potentially offering a very high return, as prices converge with Austrian land prices, with very low downside risk. (The land was sold in 2013 at over 10x the purchase price). Granted, those types of “outliers” cannot be found every day.
One might subdivide assets into two main categories:
- Growth assets generally have higher risk with higher return potential
- Defensive assets generally have lower risk with lower return potential
Once again, the above exhibit should be taken with a big grain of salt. For example does a Real Estate Investment Trust (REIT) have more the characteristics of risk/return of real estate or stocks?
The next three charts show indicative rates of returns over the past 1, 10 and 20 years for different asset classes:
Exhibit 4: Total returns for different asset classes for 2018, %2
Exhibit 5: Compounded annual growth rate for different asset classes for 10-year, %3
Exhibit 6: Compounded annual growth rate for different asset classes for 20-year, %4
As can be seen, returns among asset classes vary widely over the decades. This is one reason why diversification among asset classes is so important.
Subsequent articles in this series on asset classes will be structured as follows:
- Size of markets and trading volumes for different asset classes
- Equity as an asset class
- Debt as an asset class
- Luxury goods as an asset class
1Society of Actuaries. Investing in Illiquid Assets
2ICE US 3-month Treasury Bill Index, S&P U.S. Treasury Bond Index, Bloomberg Barclays US Bond Aggregate Bond Index, MSCI US, EAFE (Europe, Australasia, Far East) and EM indices, Bloomberg Commodity Index, LBMA Gold Price, Knight Frank’s Luxury Investment Index
3 ibid 4ICE US 3-month Treasury Bill Index, S&P U.S. Treasury Bond Index, Bloomberg Barclays US Bond Aggregate Bond Index, MSCI US, EAFE (Europe, Australasia, Far East) and EM indices, Bloomberg Commodity Index, LBMA Gold Price