In our previous article, we gave an overview of the various asset classes, and typical risk/return relationships. In this article, we compare the liquidity and trading volumes of these asset classes.
Why is this important for investors? A basic principle of asset allocation is that you need to have sufficient liquidity, to look after your personal, family and business needs, and possibly take advantage of opportunities that might present themselves (e.g. during a recession). If the asset class you are in is traded in a small market, or for whatever reasons, particularly illiquid, you might need to ride out a recession before you can dispose of your asset.
Shares in most private corporations fall into this particularly illiquid category. Few business owners realize: in times of severe recession, EBITDA (Earnings before Interest, Tax and Depreciation) might go down by 50%, and multiples might go down by 50%, meaning that your share price might go down by 50%, meaning some shares in private corporations might only be worth a quarter of what they were worth at the previous market peak! Not to mention all the difficulties related to due diligence, and investor appetite might just disappear altogether.
So a diverse portfolio is important. Let’s compare some of the alternative asset classes:
Exhibit 1: Key Global Asset Universe in 2016, trillion1
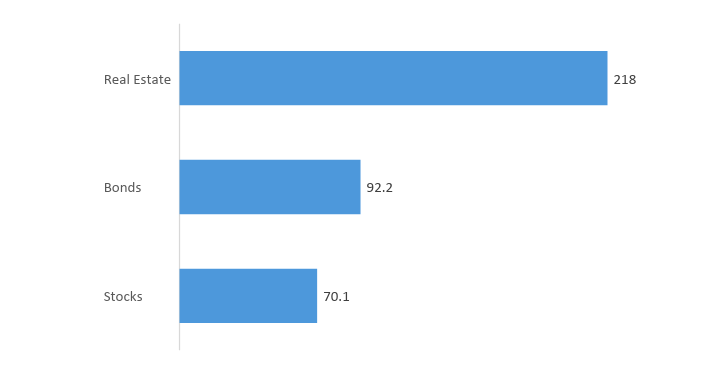 Real estate is the world’s most important asset class, with estimated total value of $217 trillion at the end of 20162. This figure includes only high quality retail property, offices, industrial, hotels, residential, other commercial uses, and agricultural land
By comparison, the size of the global bond market as at the end of 2016 was $92.2 trillion and global equity market capitalization was $70.1 trillion. The value of real estate is more than publically traded stocks and bonds put together.
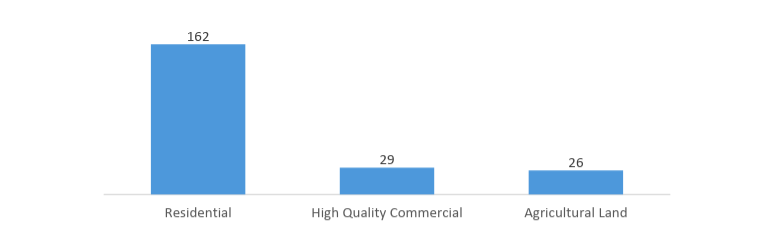
The most important component of global real estate value is residential property. According to a Savill’s report: “There are approximately 2.5 billion households on the planet and those in developed economies occupy housing at much higher price points than those in less developed economies. Savills estimate that the median value of the dwellings occupied by all households is $43,000.”3
Exhibit 2: Key Real Estate’s Categories in 2016, trillion4
Real estate is the world’s most important asset class, with estimated total value of $217 trillion at the end of 20162. This figure includes only high quality retail property, offices, industrial, hotels, residential, other commercial uses, and agricultural land
By comparison, the size of the global bond market as at the end of 2016 was $92.2 trillion and global equity market capitalization was $70.1 trillion. The value of real estate is more than publically traded stocks and bonds put together.
The most important component of global real estate value is residential property. According to a Savill’s report: “There are approximately 2.5 billion households on the planet and those in developed economies occupy housing at much higher price points than those in less developed economies. Savills estimate that the median value of the dwellings occupied by all households is $43,000.”3
Exhibit 2: Key Real Estate’s Categories in 2016, trillion4
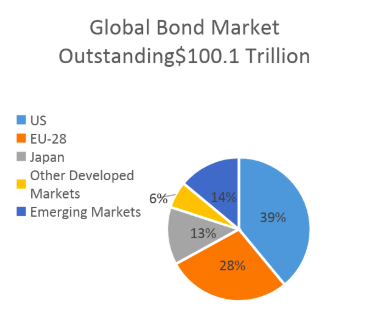
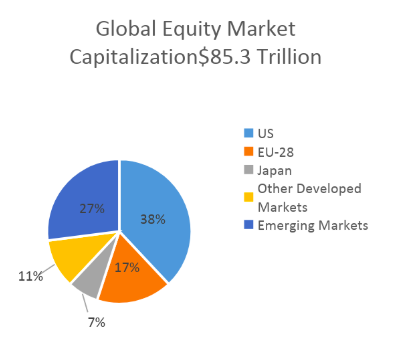
 As at the end of 2018, capitalization of global bond markets outstanding topped $100 trillion global equity markets surpassed $85 trillion.
The US dominates both global bond and equity markets; however, the role of emerging countries has risen dramatically over the past decade: in 2008 emerging markets accounted for only 5% of the global bond market and 20% of the global equity market capitalization, rising to 20% and 27% respectively in 20175.
Exhibit 3: Size of Stock Market vs Bond Market in 20176
As at the end of 2018, capitalization of global bond markets outstanding topped $100 trillion global equity markets surpassed $85 trillion.
The US dominates both global bond and equity markets; however, the role of emerging countries has risen dramatically over the past decade: in 2008 emerging markets accounted for only 5% of the global bond market and 20% of the global equity market capitalization, rising to 20% and 27% respectively in 20175.
Exhibit 3: Size of Stock Market vs Bond Market in 20176
 Trading volumes (daily average daily calculated over the course of a year) is an often-used indicator of liquidity. For example, according to the Savills report, average annual real estate trading volumes (excluding Chinese land) were $683 billion between 2008 and 2015, not that much greater than average daily(!) trading volumes of US treasuries –namely $505 billion.
Overall, average daily trading volumes of US treasuries significantly outperforms other categories of government bonds, and even combined trading volumes of NASDAQ- and NYSE-listed stocks.
Exhibit 4: Average daily trading volumes in US$ billions7
Trading volumes (daily average daily calculated over the course of a year) is an often-used indicator of liquidity. For example, according to the Savills report, average annual real estate trading volumes (excluding Chinese land) were $683 billion between 2008 and 2015, not that much greater than average daily(!) trading volumes of US treasuries –namely $505 billion.
Overall, average daily trading volumes of US treasuries significantly outperforms other categories of government bonds, and even combined trading volumes of NASDAQ- and NYSE-listed stocks.
Exhibit 4: Average daily trading volumes in US$ billions7
 Just to put a few alternative investment markets into perspective: according to the Bank of International Settlements, total value of commodity contracts traded in 2017 was $5.7 trillion8; the annual turnover of the art market turnover was estimated at $63.7 billion in 20179, according to Art Basel and UPS, which include auction sales, galleries and dealer sales.
Once again, the main take-home message here is the need for diversification—not only in returns, but also as related to liquidity. For example, owning shares in specific private corporations or real estate might very high returns, but these are also considered very illiquid investments. You need to balance this with liquid investments, including a certain amount of cash and near cash type assets. Choosing your asset classes is perhaps the most important decision you will make in designing your portfolio, and your financial well-being.
Just to put a few alternative investment markets into perspective: according to the Bank of International Settlements, total value of commodity contracts traded in 2017 was $5.7 trillion8; the annual turnover of the art market turnover was estimated at $63.7 billion in 20179, according to Art Basel and UPS, which include auction sales, galleries and dealer sales.
Once again, the main take-home message here is the need for diversification—not only in returns, but also as related to liquidity. For example, owning shares in specific private corporations or real estate might very high returns, but these are also considered very illiquid investments. You need to balance this with liquid investments, including a certain amount of cash and near cash type assets. Choosing your asset classes is perhaps the most important decision you will make in designing your portfolio, and your financial well-being.
Real estate is the world’s most important asset class, with estimated total value of $217 trillion at the end of 20162. This figure includes only high quality retail property, offices, industrial, hotels, residential, other commercial uses, and agricultural land
By comparison, the size of the global bond market as at the end of 2016 was $92.2 trillion and global equity market capitalization was $70.1 trillion. The value of real estate is more than publically traded stocks and bonds put together.
The most important component of global real estate value is residential property. According to a Savill’s report: “There are approximately 2.5 billion households on the planet and those in developed economies occupy housing at much higher price points than those in less developed economies. Savills estimate that the median value of the dwellings occupied by all households is $43,000.”3
Exhibit 2: Key Real Estate’s Categories in 2016, trillion4
As at the end of 2018, capitalization of global bond markets outstanding topped $100 trillion global equity markets surpassed $85 trillion.
The US dominates both global bond and equity markets; however, the role of emerging countries has risen dramatically over the past decade: in 2008 emerging markets accounted for only 5% of the global bond market and 20% of the global equity market capitalization, rising to 20% and 27% respectively in 20175.
Exhibit 3: Size of Stock Market vs Bond Market in 20176
Trading volumes (daily average daily calculated over the course of a year) is an often-used indicator of liquidity. For example, according to the Savills report, average annual real estate trading volumes (excluding Chinese land) were $683 billion between 2008 and 2015, not that much greater than average daily(!) trading volumes of US treasuries –namely $505 billion.
Overall, average daily trading volumes of US treasuries significantly outperforms other categories of government bonds, and even combined trading volumes of NASDAQ- and NYSE-listed stocks.
Exhibit 4: Average daily trading volumes in US$ billions7
Just to put a few alternative investment markets into perspective: according to the Bank of International Settlements, total value of commodity contracts traded in 2017 was $5.7 trillion8; the annual turnover of the art market turnover was estimated at $63.7 billion in 20179, according to Art Basel and UPS, which include auction sales, galleries and dealer sales.
Once again, the main take-home message here is the need for diversification—not only in returns, but also as related to liquidity. For example, owning shares in specific private corporations or real estate might very high returns, but these are also considered very illiquid investments. You need to balance this with liquid investments, including a certain amount of cash and near cash type assets. Choosing your asset classes is perhaps the most important decision you will make in designing your portfolio, and your financial well-being.
1Savills, Bank of International Settlement (BIS), World Federation of Exchanges
2Savills – Around the world in dollars and cents 2016
3Savills – Around the world in dollars and cents 2016
4ibid
5SIFMA Fact Book 2018
6Data as of 31 December, 2017, Bank of International Settlement (BIS), World Federation of Exchanges
7Data as of 31 December, 2017, SIFMA Fact Book 2018, UK Debt Management Office (DMO), Germany Finance Agency, Japan Securities Dealers Association
8SIFMA Fact Book 2018
9An Art Basel & UBS Report – The Art Market 2018